Windographer
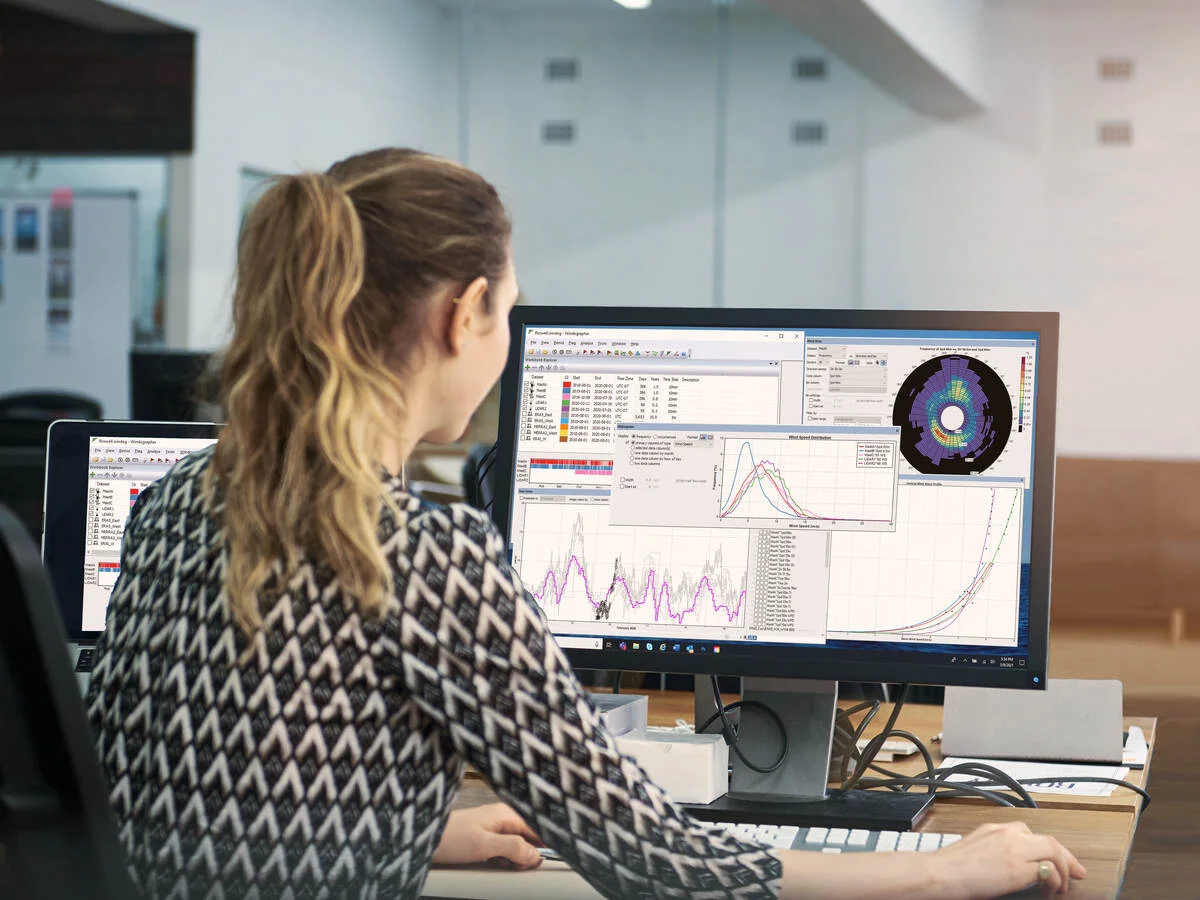
Industry leading software for importing, analyzing and visualizing wind resource data from met towers, sodar, and lidar systems.
Register Now and Get Your Windographer 6 Trial
Experience the power of Windographer 6 with our free 2-week trial. No credit card required.
Get Free Trial →Import, analyze and visualize wind data quickly and easily with Windographer by UL Solutions. Our industry-leading software can process wind resource data measured by met tower, lidar or sodar. Use Windographer to import virtually any data format, analyze and manage multiple datasets, keep a record of changes made and restore data. Create time series graphs, wind roses, frequency histograms, scatterplots, and more. And when you’re ready, produce formatted reports or export data into any wind flow model used within the industry.
Key features
Core features
- Long-term adjustment module capable of handling multiple onsite and reference datasets
- Boom orientation and displacement height
- Vertical extrapolation of wind speed, direction, turbulence and temperature
- Data reconstruction, shear and turbulence analysis, in situ comparison of anemometers
Data management
- Import virtually every data format including: NRG, Ammonit, Kintech, Campbell, AQSystem, ZX Lidars and Windcube
- Read calibration constants from raw data files and re-calibrate
- Read from and write to any SQL database
- Combine co-located anemometers, fill gaps, apply time shifts and create calculated data columns
- Extrapolate speed, direction, temperature and turbulence data to multiple heights
Quality control
- Define your own flags
- Apply flags to data segments manually or automatically
- Use flags as filter criteria
Long-term adjustment
- Download ERA5 and MERRA-2 long-term reference data for free
- Compare possible long-term reference datasets based on correlation and uncertainty
- Choose from several algorithms including linear least squares, variance ratio and matrix method
- Compare algorithms and settings in terms of their performance and their uncertainty
- Lengthen or scale the target dataset to expected long-term conditions
Professional output
- Export multiple-height time series data to Openwind
- Export to WAsP, WindFarmer, WindSim and Meteodyn WT
- Export graphs and tables to PNG or text files
- Enterprise edition imports/exports to any SQL database
Interested in learning more about Windographer?
FAQs, and additional resources to enhance your experience with the software.