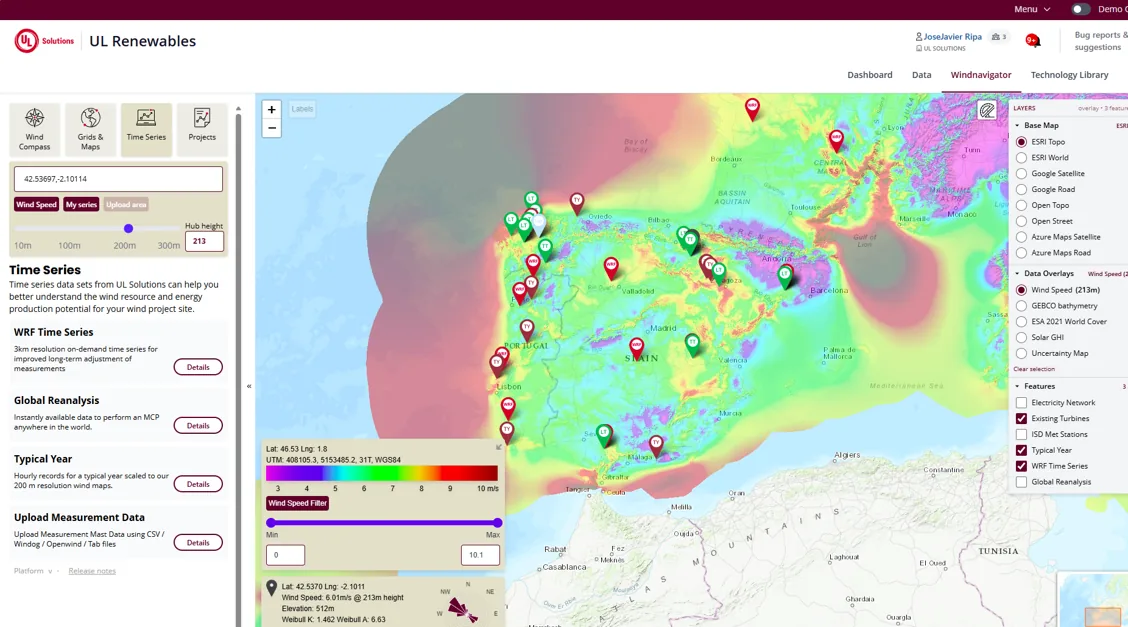
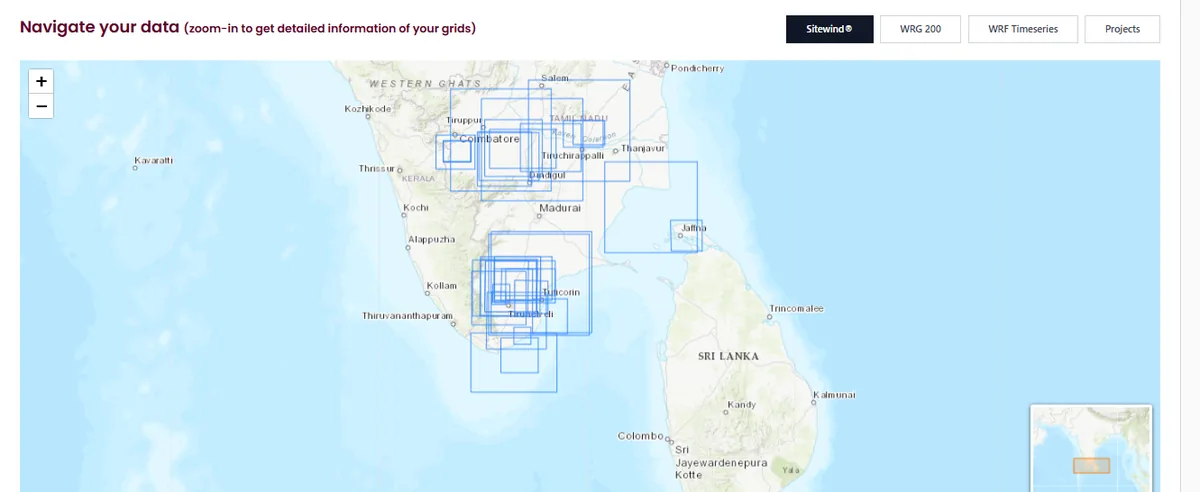
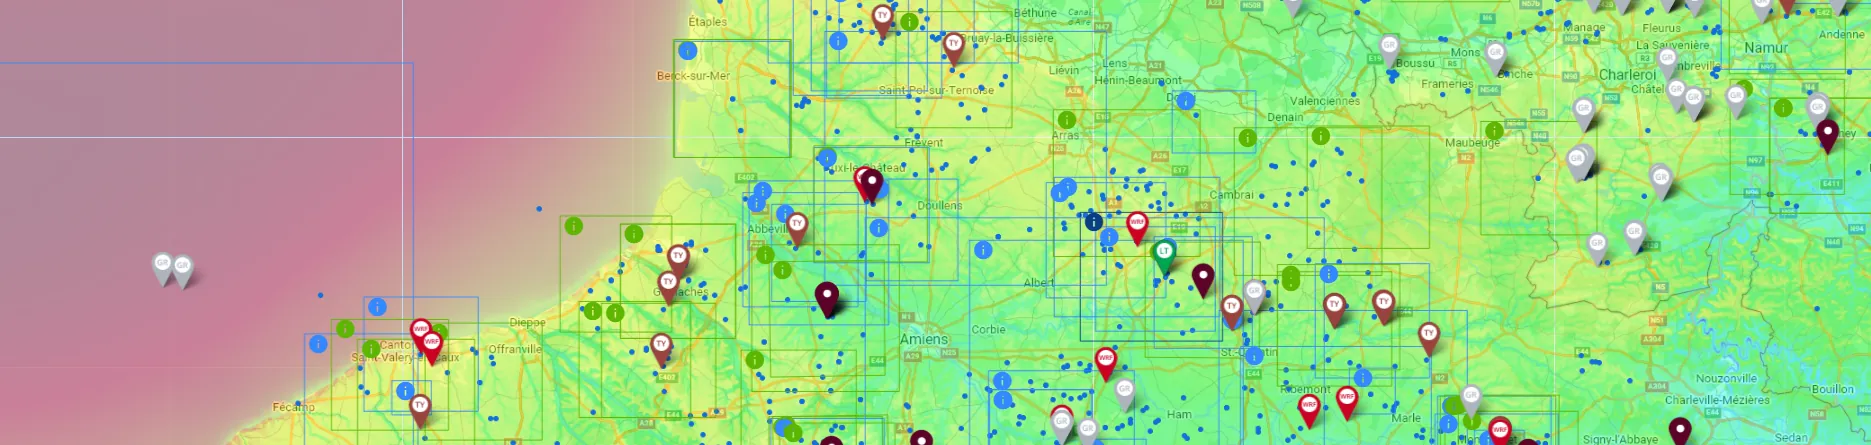
Windnavigator wind resource map with project and data locations
WIND DATA, PROJECTS AND CONNECTED ANALYSIS

WINDNAVIGATOR

Your data has a better home.

A map-based environment for wind-resource data, measurement campaigns, grid adjustment, technology libraries, automated workflows and connected Windographer and Openwind projects.

WINDNAVIGATOR FUNCTIONS

A common project and data layer for wind analysts.

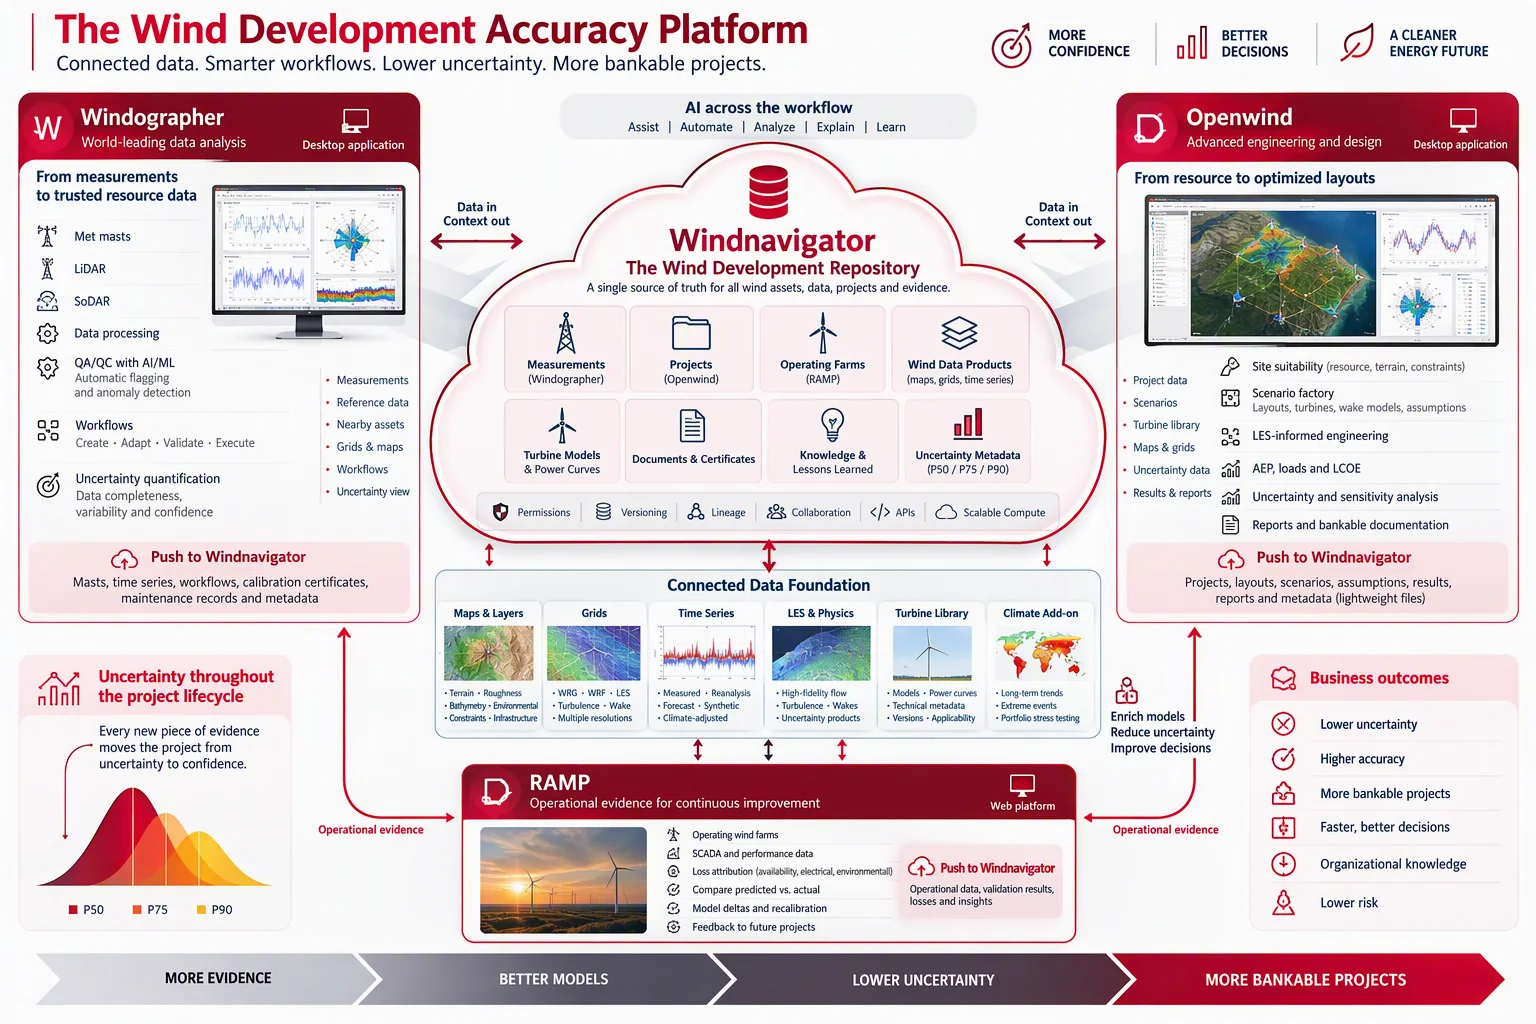
Windnavigator does not replace Windographer or Openwind. Analysts continue using the specialist desktop applications. Windnavigator provides persistence, shared project context, controlled access to data and bidirectional exchange between tools.

Windnavigator repository with project assets and map context
02

Measurement & Projects Repository

Keep met mast, LiDAR and SoDAR campaigns, raw and processed series, quality status, processing history, grids, Openwind projects, layouts, scenarios, assumptions, reports, certificates and approvals under one project identity.

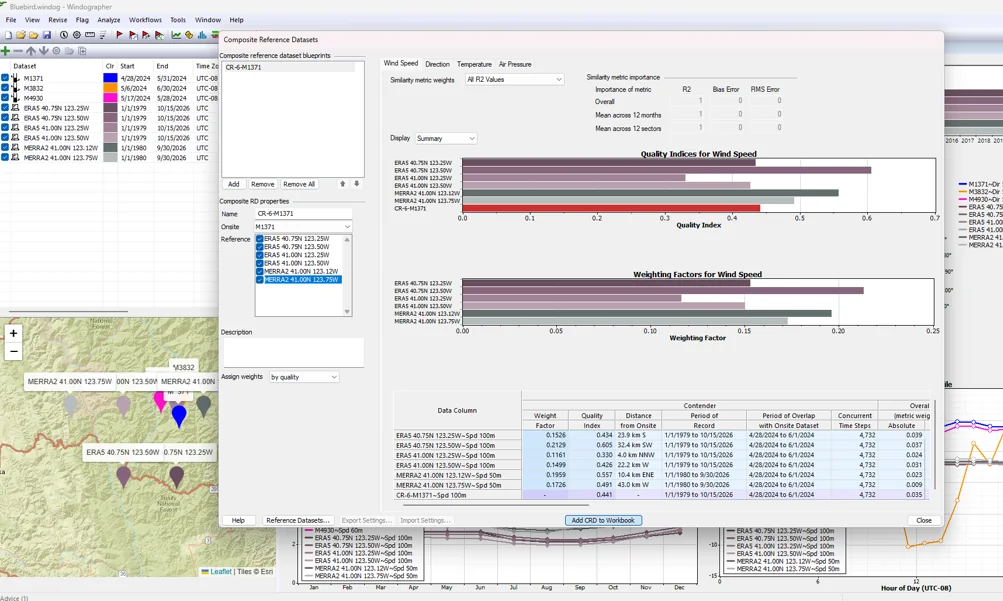
Windographer Composite Reference Datasets with quality indices and weighting factors
03

Windographer Sync

Push campaigns, raw and processed time series, QC status, processing history and approved outputs to Windnavigator. Pull reference series, nearby measurements, grids, project context and reusable workflows into Windographer.

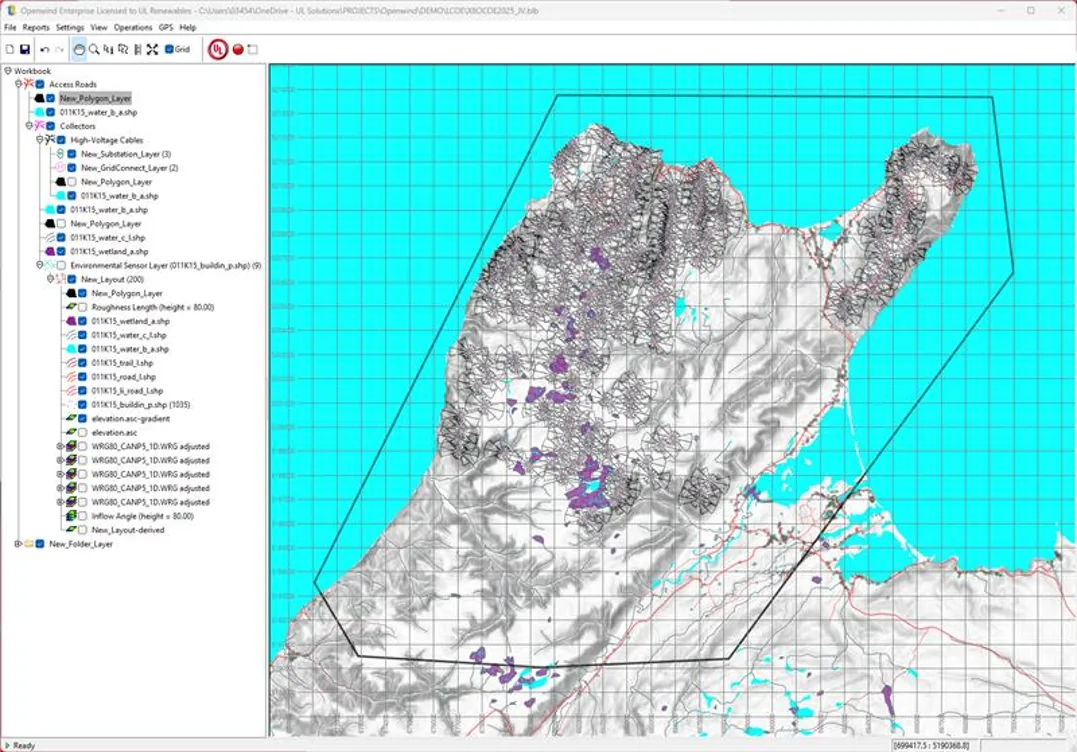
Openwind project synchronized with Windnavigator
04

Openwind Sync

Pull maps, grids, time series, turbine models, power curves, constraints and development layers into Openwind. Push projects, layouts, scenarios, assumptions, reports and outputs back to the same Windnavigator project.

MEASUREMENT DATA CONTROL

Repository

The optimal home for every Windographer run

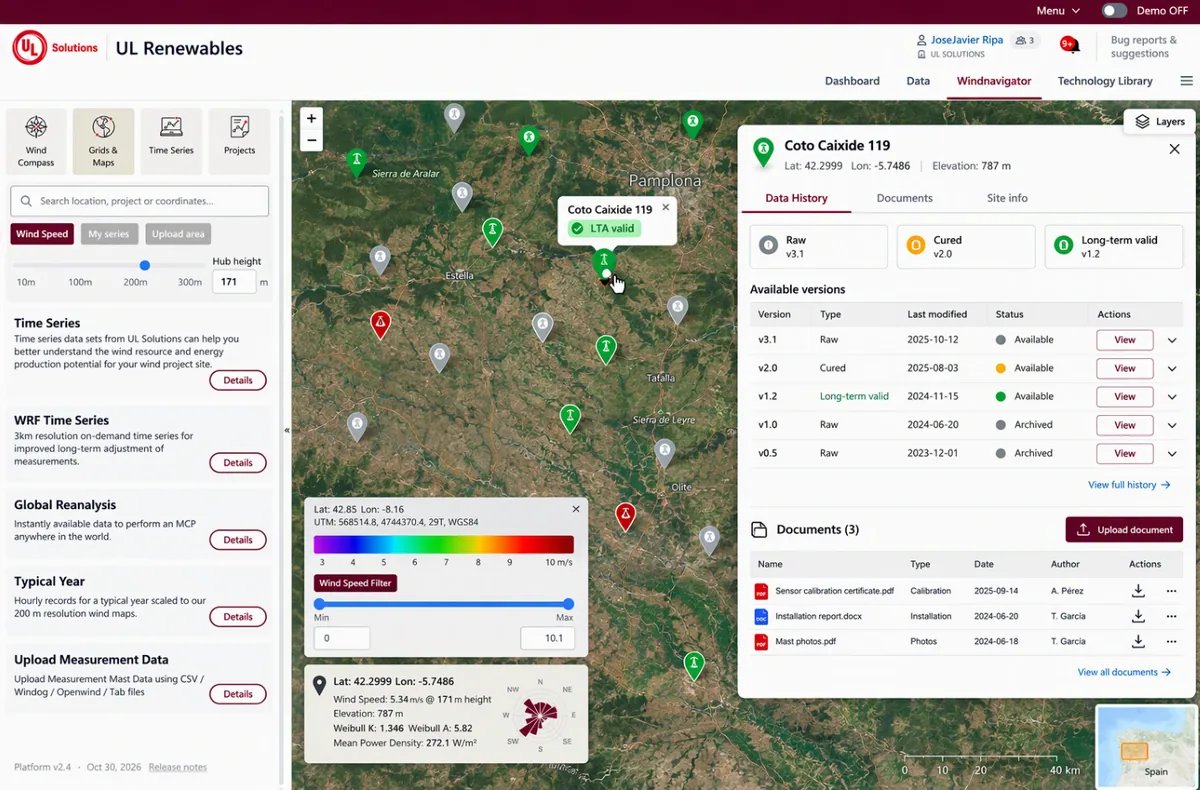
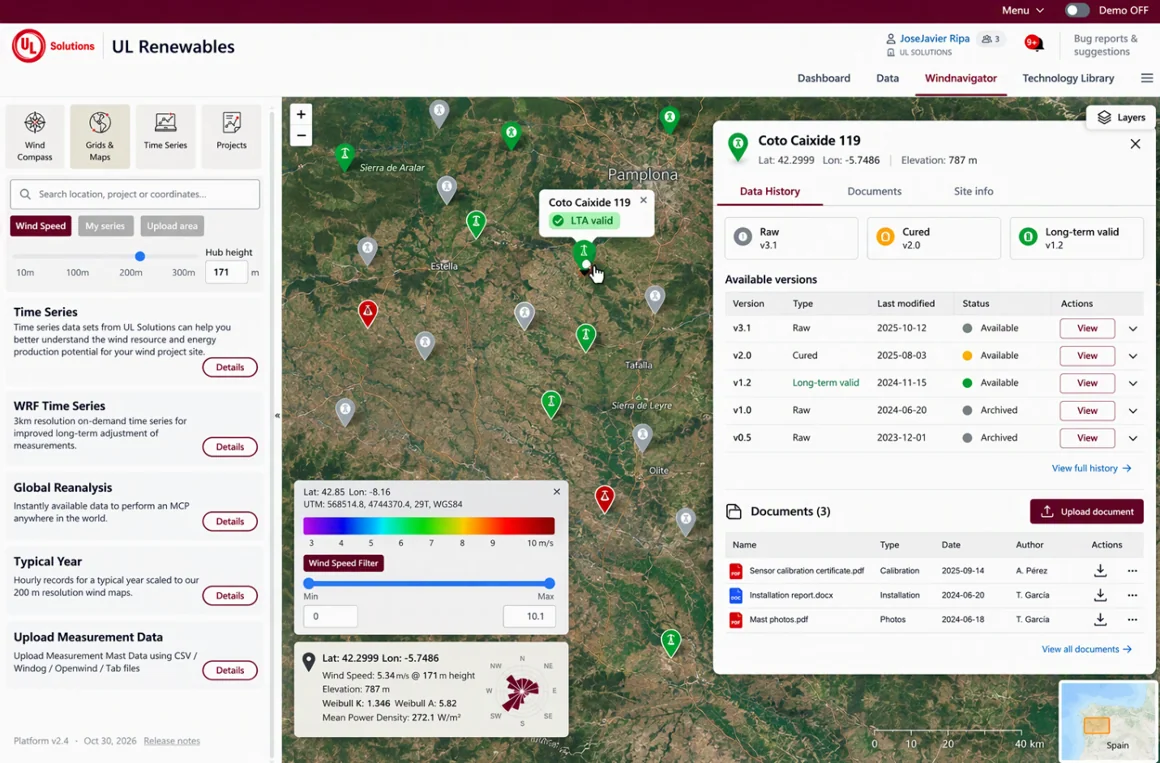
Windnavigator map-based mast repository with Raw, Cured and Long-term valid history, documents and WRF Time Series access
1

One structured record for every campaign

Keep every met mast, LiDAR or SoDAR campaign in one map-based repository instead of scattered Windographer files and analyst-specific folder structures.

2

Raw → Cured → Long-term valid

Publish Windographer results back to the same station. Raw data, cured series and long-term-valid datasets remain clearly labelled, versioned and easy to retrieve.

3

Data and field documentation together

Attach calibration certificates, installation reports and mast sketches to the measurement station, alongside sensor configuration, processed series and the full analysis history.

4

MCP and long-term adjustment with less setup

WRF Time Series are directly available for MCP and long-term adjustment. Run standard Windographer workflows from Windnavigator and return the output to the same governed station record.

GRID ADJUSTMENT

Measurements and wind-resource grids, together in one workflow.

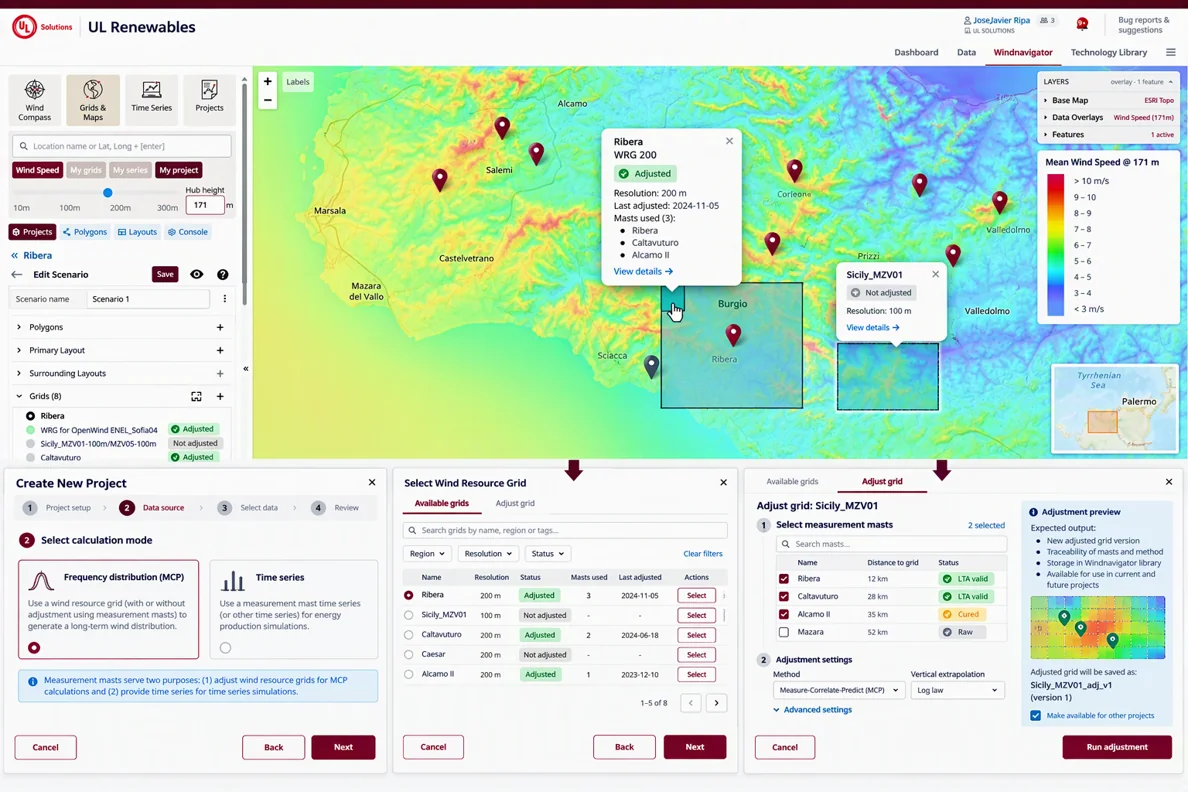
Windnavigator keeps the measured data and the WRG/WRB resource grids in the same project, making grid adjustment simpler, more accurate and fully traceable.

1

Select the grid

Choose an existing WRG/WRB and immediately see whether it is adjusted, when it was last adjusted and which measurements were used.

2

Select valid measurements

Use nearby met mast, LiDAR or SoDAR datasets with their Raw, Cured or Long-term valid status visible before adjustment.

3

Run a traceable adjustment

Apply the selected adjustment method and retain the measurement inputs, methodology, date and resulting grid version.

4

Reuse the adjusted grid

Make the adjusted resource available to other projects, Windnavigator calculations and Openwind without rebuilding the analytical trail.

Windnavigator workflow for selecting measurements and adjusting wind-resource grids
PROJECTS · OPENWIND ENGINE

Project screening and evaluation in minutes, powered by Openwind.

Run complete early-stage assessments and portfolio evaluations in a streamlined Windnavigator web workflow, while Openwind remains the engineering engine running through API underneath. Pre-adjusted resource grids, site constraints and automated project setup produce decision-ready results in less than 30 minutes.

1

Find the best project location

Use Neighbours Radar together with electrical infrastructure, environmental restrictions, resource layers and other GIS overlays to identify promising areas and account for surrounding wind farms from the start.

2

Run the project evaluation

Configure turbine technology, layouts, losses and scenarios, then run EYA, technology comparisons and layout optimization directly in Windnavigator with Openwind as the calculation engine.

3

Early-stage speed, detailed-analysis accuracy

The automated workflow can be completed in less than 30 minutes. The detailed bankable workflow used for validation typically takes several days and can extend to weeks.

4

Designed for screening and portfolio decisions

Generate reports and engineering outputs quickly for greenfield screening or time-constrained portfolio / M&A evaluation, with Excel, KML/KMZ, BLB and time-series outputs available for further review.

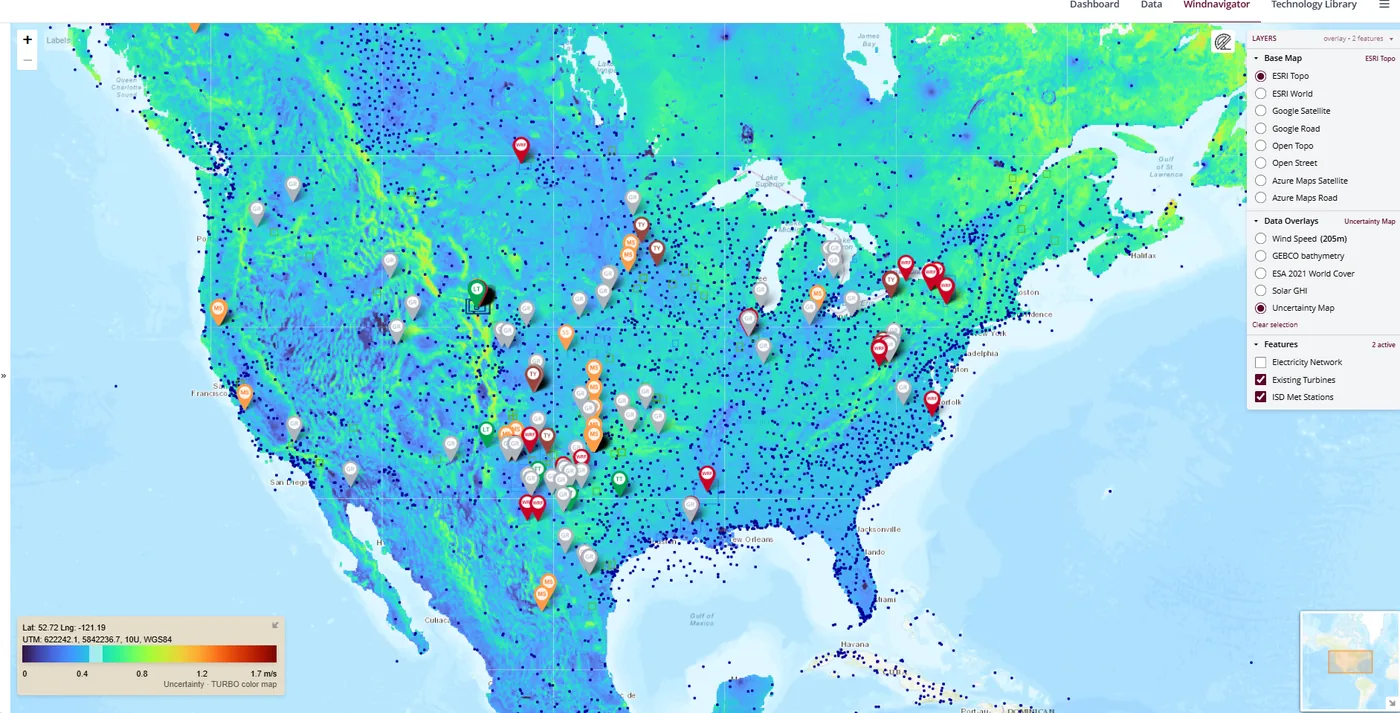
Windnavigator uncertainty layer with adjusted measurement stations, existing turbines and infrastructure overlays
Empirical uncertainty layer Uncertainty is estimated spatially from terrain complexity and distance to the valid measurement stations used to pre-adjust the 200 m resource grids.

Why the fast workflow performs well: Windnavigator starts from 200 m resource grids that have been pre-adjusted using thousands of properly evaluated, fully valid measurement stations.

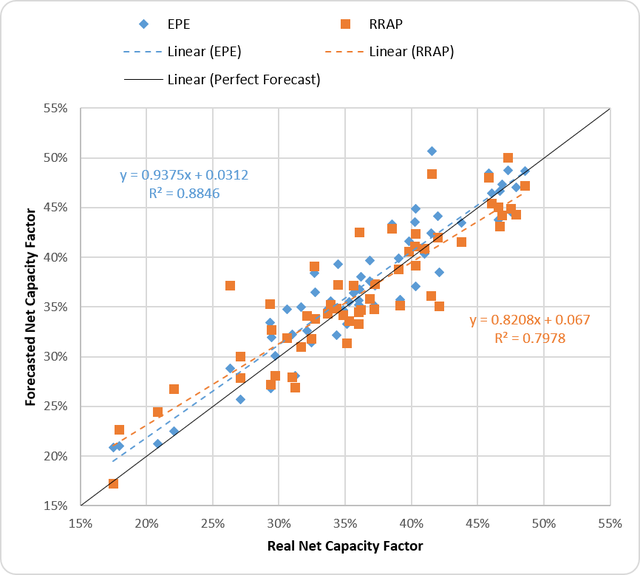
Preliminary versus reference net capacity factor validation
Validated against operating-project production Windnavigator early-stage results and the full detailed evaluation are both benchmarked against actual project production, providing a common real-world reference.
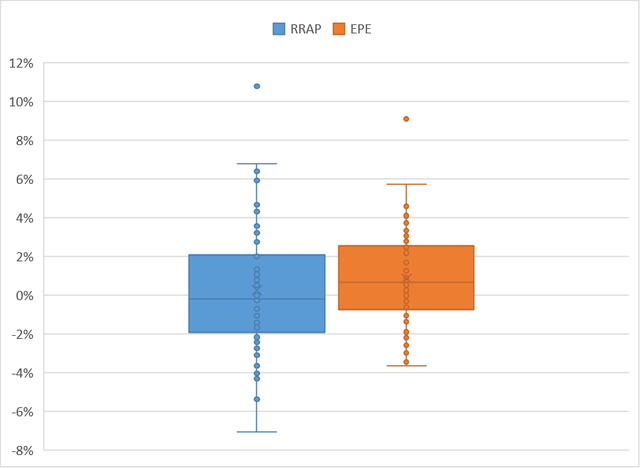
Distribution of preliminary evaluation error
Comparable accuracy, radically different analysis time The Windnavigator workflow runs in less than 30 minutes; the detailed bankable workflow typically requires several days and can extend to weeks.
ADDITIONAL BENEFITS

More than a project workspace.

Windnavigator also gives analysts shared technology data, existing-wind-farm context, programmatic access to wind statistics, and practical benefits across the wider software portfolio.

Windnavigator Technology Library comparing turbine power curves
01

Technology Library

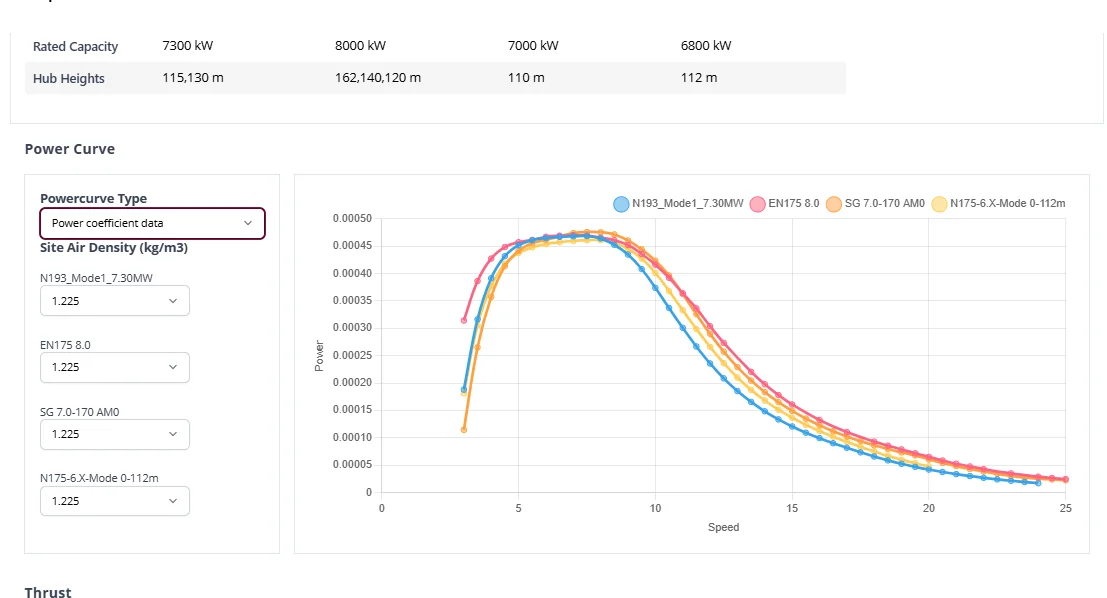
Search and compare commercial wind-turbine models in one maintained library, including rated capacity, hub-height options, power and thrust curves. Agreements with major wind-turbine OEMs help keep the technical documentation and model information up to date. The library is directly available from Projects, so analysts can select the appropriate turbine model for each calculation without rebuilding or transferring turbine definitions manually. Private or project-specific turbine definitions can also be maintained alongside the shared library.

Windnavigator Neighbours Radar showing existing turbines and automatically retrieved turbine characteristics
NEIGHBOURS RADAR
02

Existing Turbines Database

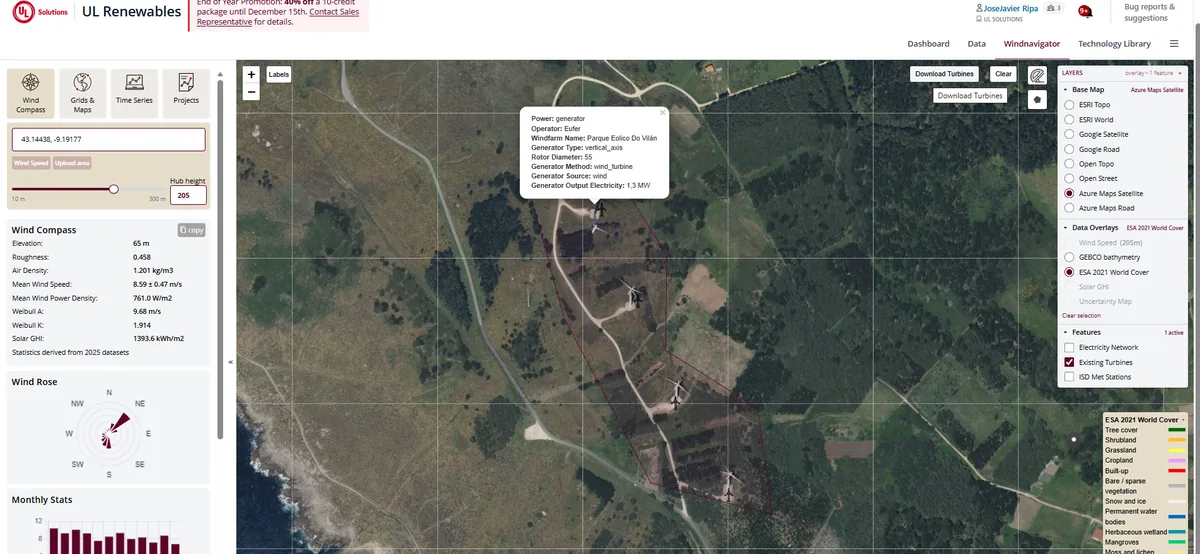
Detect and select surrounding wind farms directly on the map and automatically retrieve the available characteristics for each turbine. Windnavigator combines its own existing-turbine database with data from thewindpower.net under agreement, providing approximately 95% global coverage. The Neighbours Radar removes much of the manual GIS and turbine-identification work needed to define the surrounding-wind-farm context for screening, wake analysis and Projects.

Windnavigator map showing wind-speed layers, measurement stations and project assets available through programmatic workflows
03

API

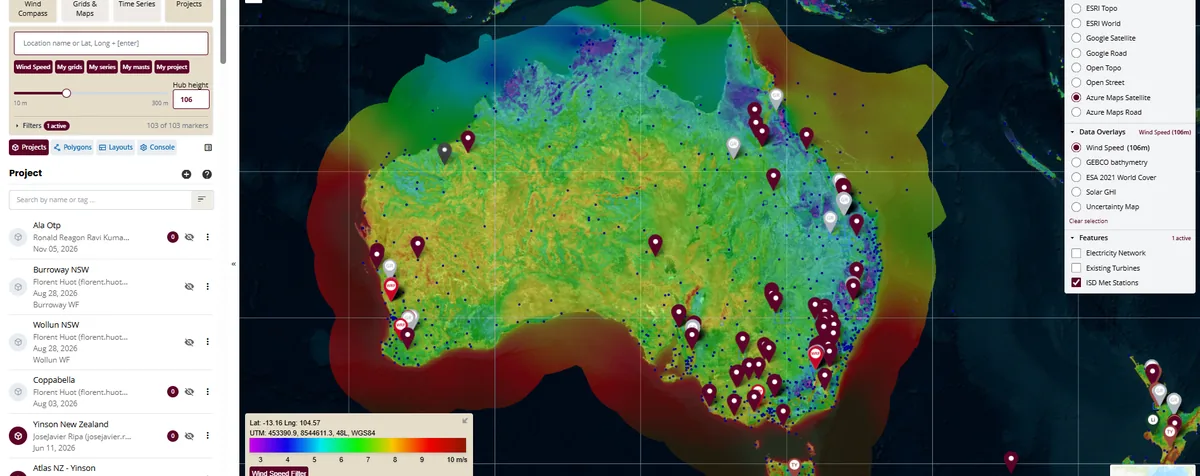
Access Windnavigator wind statistics programmatically for automated workflows, internal tools and repeatable portfolio processes without relying only on manual interaction with the web interface.

Windnavigator Dashboard map showing purchased and generated data products with product filters
04

Dashboard

Manage UL renewables software and data access from one place: user permissions, Single Sign-On and licenses for Windnavigator, Windographer, Openwind, HOMER Front and other products. Keep a record of each data-product run and retain access to previously generated grids, time series and project outputs, so users can retrieve or reprocess them without rebuilding the original order or analysis context.

COMMERCIAL BENEFITS Subscription discounts and flexible credits

Companies with an active Windnavigator subscription receive a 10% discount over pricelist. Credit bundles provide access to larger discounts, and credits do not expire while the subscription remains active.

CONNECTED DATA FLOW

Bidirectional exchange without disconnected handoffs.

Users remain in Windographer and Openwind for specialist analysis. Windnavigator stores and governs the shared project record and makes approved inputs available to both applications.

1

Windographer → Windnavigator

Campaign definition, measurements, processed series, QC history, workflows and approved outputs.

2

Windnavigator → Windographer

Reference data, nearby measurements, grids, project context and reusable workflows.

3

Windnavigator → Openwind

Resource data, turbine and power-curve libraries, constraints, development layers and project context.

4

Openwind → Windnavigator

Projects, layouts, scenarios, modelling assumptions, reports and calculated outputs.

Bidirectional Windographer Windnavigator Openwind workflow
OPTIONAL MODULE · SEPARATE SUBSCRIPTION

Windnavigator Opps

Bring operational wind farms into Windnavigator and close the loop between pre-construction modelling and actual plant performance.

From expected production to traceable performance attribution.

Operational production mixes resource variability, wakes, availability, curtailment, turbine controls and efficiency. Windnavigator Opps adds an operational layer that reconstructs a consistent free-stream wind reference and uses it to explain where the production gap comes from.

MMDT: a continuous virtual mastWRF time series and machine learning reconstruct site-specific 10-minute wind speed, direction, density, temperature, shear and turbulence. The MMDT becomes the free-stream reference for operational analysis.
From free wind to turbine-level baselineOpenwind adjusts the virtual-mast signal to each turbine position, accounting for wakes and local wind flow. SCADA and operational parameters refine the reference further.
Losses you can attributeCompare ideal and actual production to separate resource, wake, availability, curtailment and efficiency effects instead of leaving performance variance unexplained.
Operations feed the next designReuse validated resource behaviour, loss attribution and operational evidence to improve pre-construction assumptions and models for the next project.
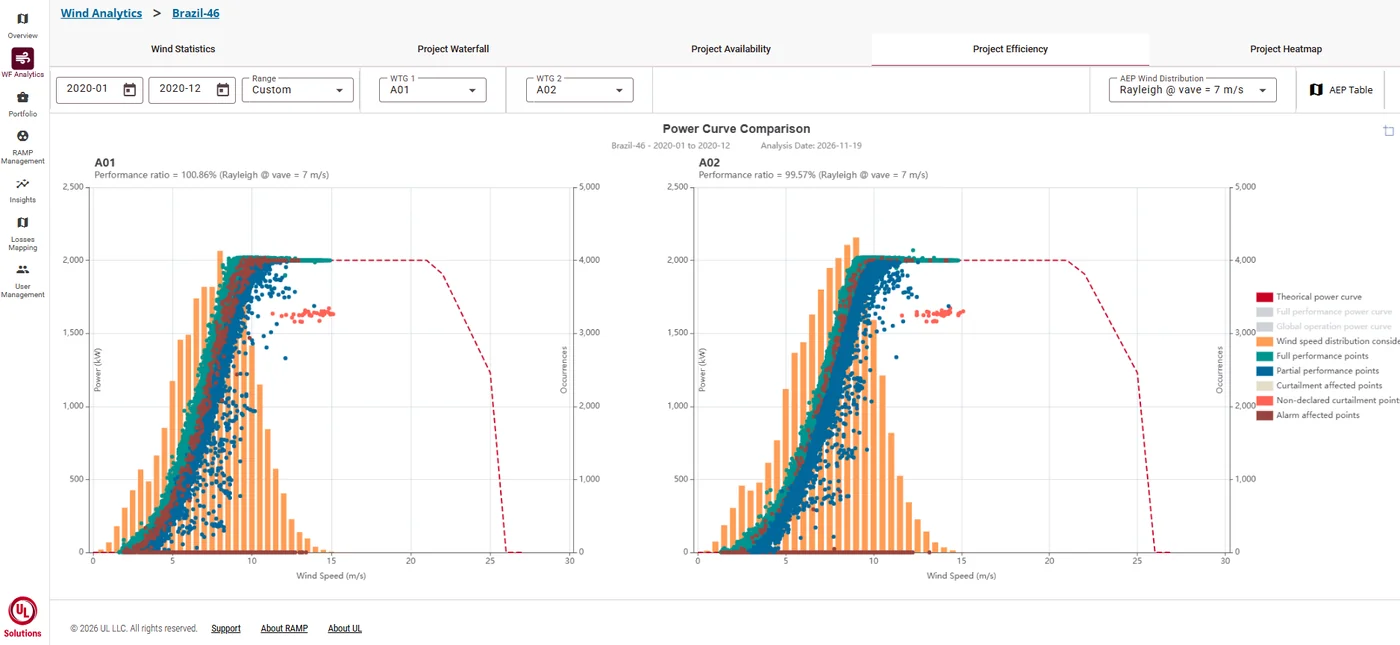
RAMP Wind Analytics power-curve comparison showing turbine performance points, wind-speed distribution and theoretical curve
Close the loop Resource assessment → Design → Operations → Loss attribution → Better pre-construction models

WINDNAVIGATOR
Your data has a better home.

A persistent, map-based project record for measurements, wind-resource data, Openwind projects and the links between them.