Expanded offshore coverage
Coverage now extends across Latin American Exclusive Economic Zones, up to 200 nautical miles (370.4 km) offshore. Wind statistics in Windnavigator support early-stage screening of offshore wind opportunities.
Product update
The 2026 Latin America Wind Atlas is a major update to the original map released in 2012. Available through UL Solutions’ Windnavigator Resource Data and Maps software, it covers South America, Central America, the Caribbean and Mexico at 200 m resolution, with offshore coverage extending across Exclusive Economic Zones.
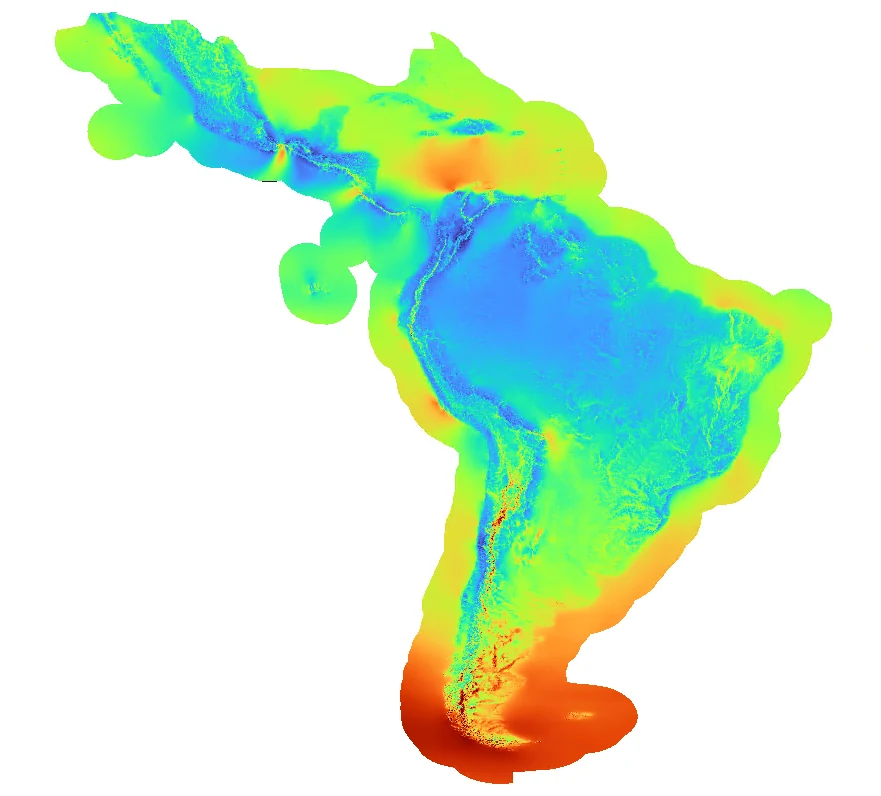
The 2026 atlas was developed using UL Solutions’ coupled mesoscale and microscale modeling system. The Weather Research and Forecasting (WRF) model, driven by ERA5 reanalysis, captures regional atmospheric conditions, while microscale modeling resolves the influence of terrain and surface characteristics at 200 m resolution. The resulting long-term mean wind speeds were then refined using UL Solutions’ observation database to reduce systematic bias and improve regional accuracy.
For calibration and independent validation, 1,177 wind observations were quality-controlled and aggregated into 365 representative met stations. Leave-one-out cross-validation shows a clear improvement over both the original UL Solutions map and the Global Wind Atlas, supporting more informed early-stage site screening and comparison of development opportunities.
Coverage now extends across Latin American Exclusive Economic Zones, up to 200 nautical miles (370.4 km) offshore. Wind statistics in Windnavigator support early-stage screening of offshore wind opportunities.
Mean wind speed maps are available from 10 m to 300 m above ground level, compared with a maximum height of 140 m in the original maps.
The upgraded modeling system uses the Weather Research and Forecasting (WRF) mesoscale model and ERA5 reanalysis, combined with UL Solutions’ microscale modeling and observation-based map adjustment.
The atlas helps developers compare broad areas, identify promising locations and prioritize where to invest in measurement campaigns and detailed resource assessment.
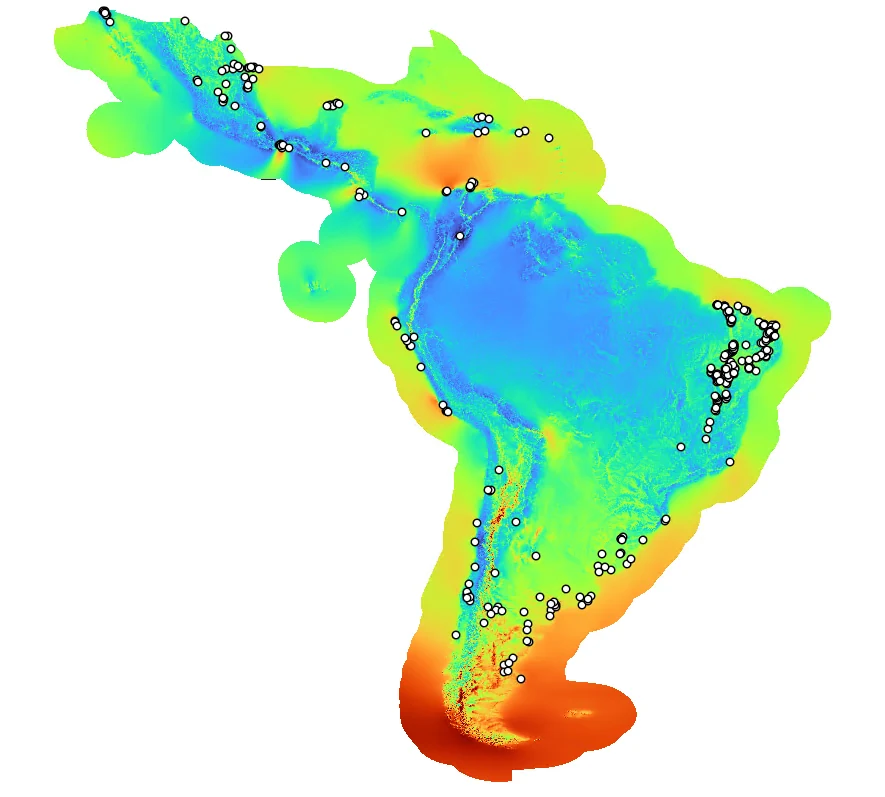
2026 Latin America Wind Atlas