Homer Front 1.4 is here
Homer Front 1.4

New in HOMER Front 1.4

Smarter planning
Capture multi-year variability and evolving market conditions.

Operational efficiency
Maximize use of curtailed energy and manage lifecycle losses. [Coming Q4 2025]

Bankable results
Align with investor and regulatory requirements across regions.

Faster decisions
Standardized, transparent outputs accelerate team alignment.
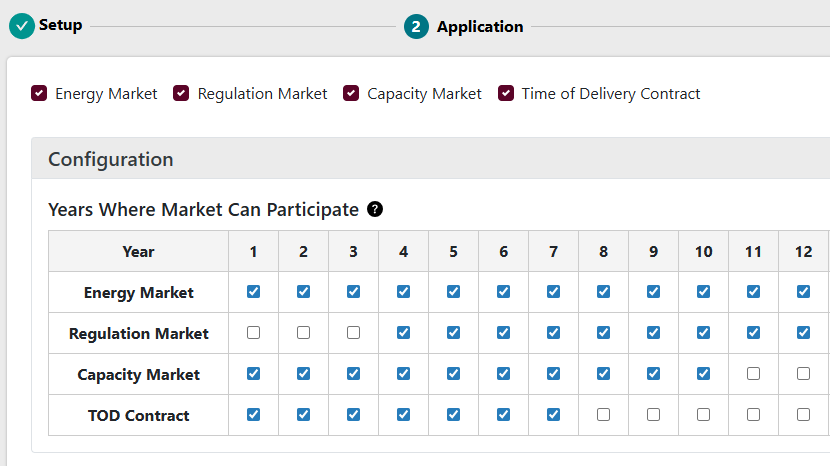
Multi-year Modeling
Plan with confidence across the full lifecycle of your project.
Simulate year-by-year dynamics and understand how changing market, grid, and resource conditions affect long-term performance.
Request a demoYear-by-year market eligibility
Reflect evolving participation rules and incentives over time.
Variable TOD pricing & obligations
Model annual changes in time-ofdelivery prices and delivery requirements.
Interconnection & curtailment variability
Account for grid constraints and curtailment risks that shift year to year.
Wind & solar resource variability
Capture interannual fluctuations in renewable generation for more accurate yield and revenue forecasts.
Fixed Grid Tolls
Align with real-world tariff structures and improve renewable utilization.
Define static tolls for grid imports, allowing the optimizer to favor curtailed renewable energy over grid purchases.
[Coming Q4 2025]
Request a demo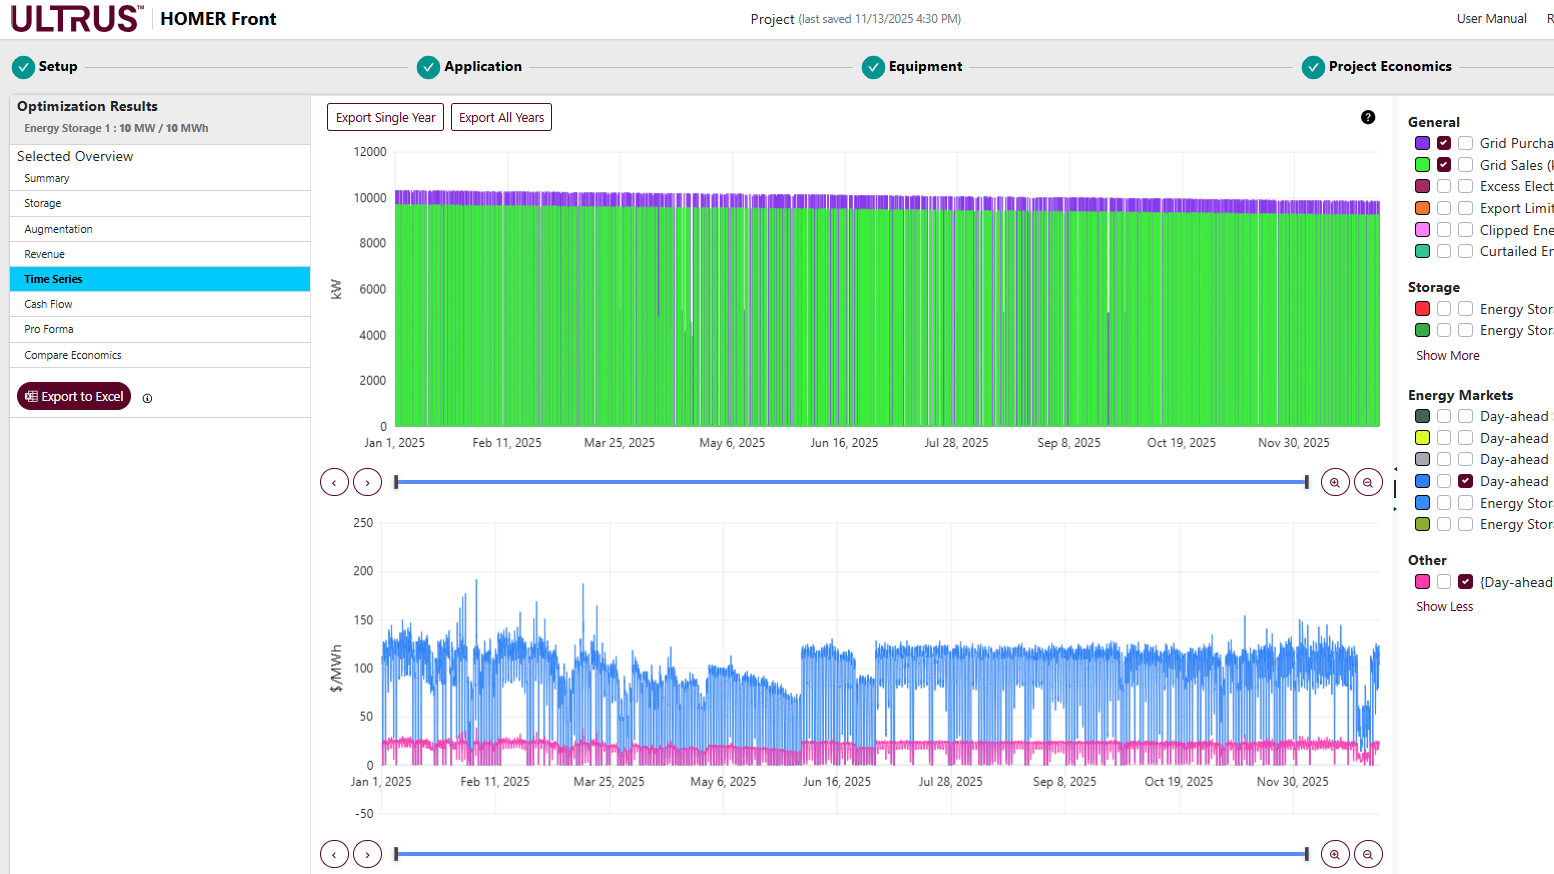
Support for Fixed-Price Imports
Assign a constant toll rate for grid energy to represent stable tariff or wheeling charges.
Renewable Priority Optimization
Encourage the optimizer to use curtailed PV and wind generation before purchasing grid energy, maximizing renewable self-consumption and reducing costs.
Global tariff applicability
Support tariff frameworks used in North America, Europe, and emerging marketings where grid access is priced separately from energy rates.
Contract modeling
Aligns system simulations with contractual and regulatory ricing structures used by utilities and financiers.
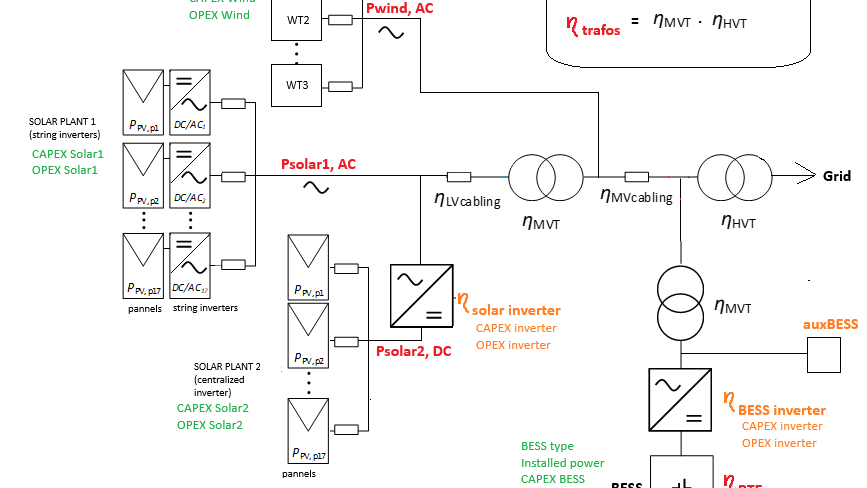
Efficiency & Lifecycle Modeling
Visualize and manage performance across the full system lifecycle.
Understand where energy is lost, plan augmentations, and ensure reliability through endof-life transitions.
[Coming Q4 2025]
Request a demoLosses visualization
New charts reveal conversion inefficiencies and roundtrip losses.
End-of-life management
Plan for system aging and evaluate cost-effective replacement options.
Scenario comparison
Compare losses across different configurations, markets, or degradation scenarios to select the most efficient strategy.
Capacity Market Enhancements
Model participation and commitments with greater transparency
Enhancements in this release help ensure your simulations reflect real capacity market obligations facilitating proactive ugmentation strategies to maintain contractual requirements without overbuilding upfront.
Request a demo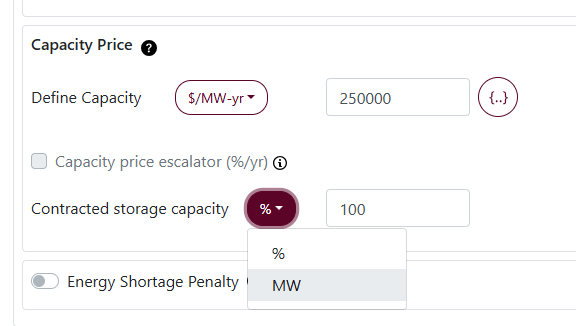
MW-Based commitments
Accurately model firm delivery obligations measured in MW, improving alignment with real-world capacity market structures.
Bankability and contract precision
Provide clearer obligations for performance guarantees, reducing risk for lenders and investors.
Realistic performance estimates
Commitments account for degradation, ensuring obligations match actual deliverable power over the asset’s life.
Reporting & Usability Upgrades
Make analysis faster, clearer, and easier to share across your organization.
The latest usability improvements in Homer 1.4 bring a new level of standardization and clarity to results interpretation. With refined outputs, standardized units, and powerful Excel export tools, users can now generate, visualize, and distribute project insights in less time and with greater consistency.
Request a demoStandardized units & formats
Ensure consistency between model outputs and stakeholder reports with unified data presentation.
Enhanced results tables
Harmonized headers, consistent formatting, and improved cell accessibility, making post-processing faster, easier, and less error-prone.
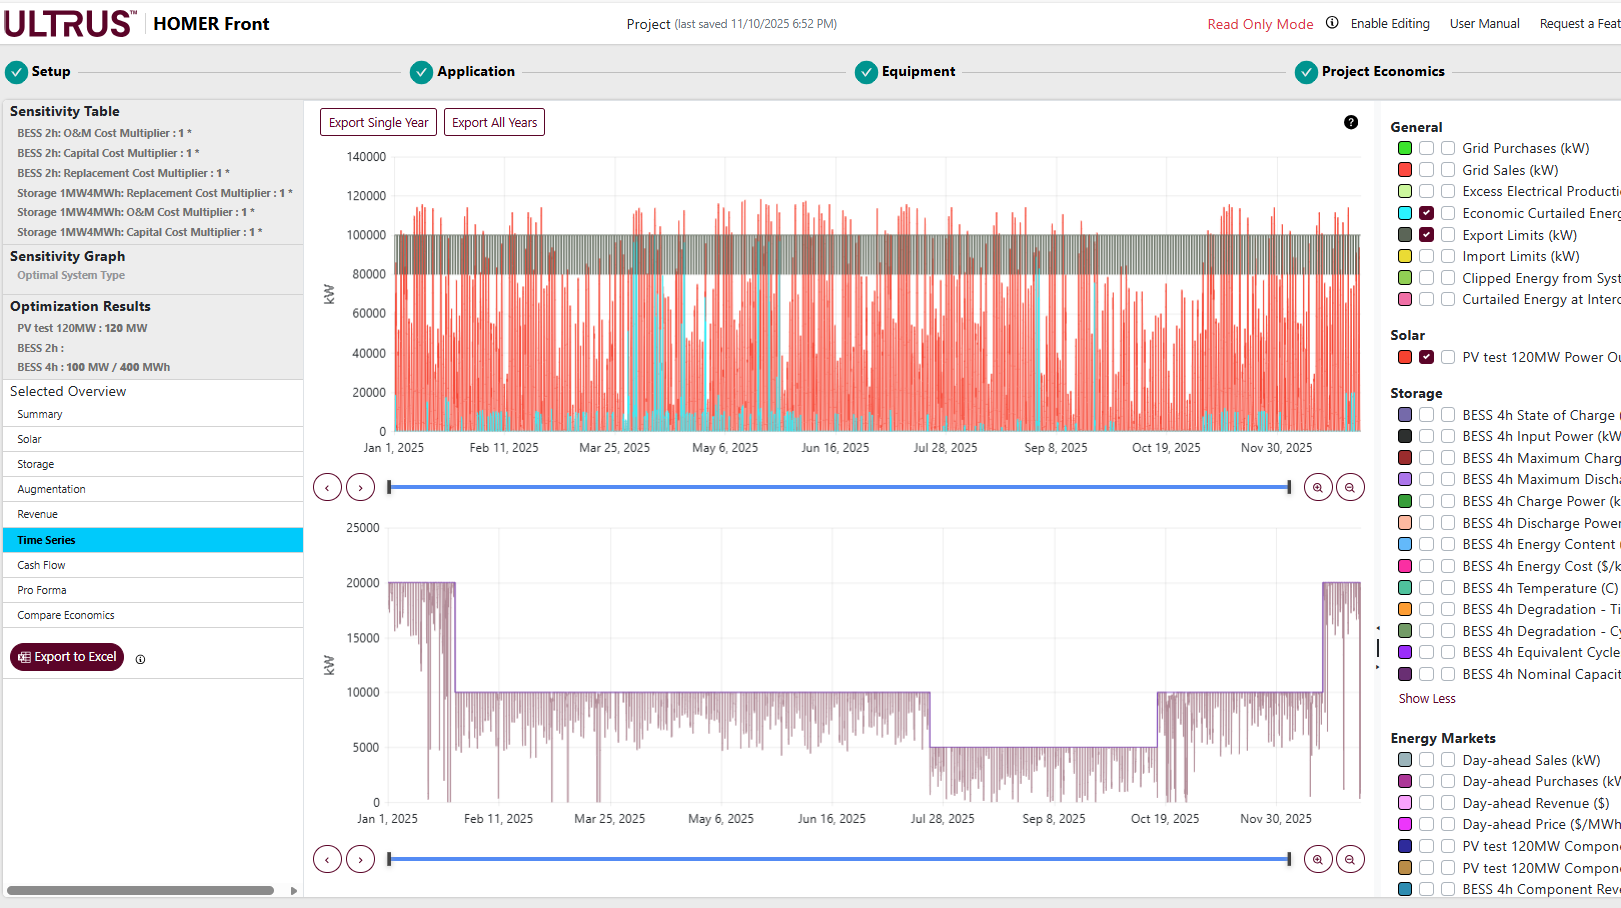
Dual-variable plotting
Compare key metrics like SOC vs revenue or dispatch vs losses to understand performance tradeoffs.
Excel export of optimized results
Export multi-scenario tables to streamline sensitivity analysis and enhance reporting.